What Is Regression Beta?
We ran a regression analysis on STC’s stock returns vs. TASI—the results reveal crucial insights about market risk in Saudi Arabia.
Understanding Regression Beta
Regression beta measures the sensitivity of a stock’s returns compared to the overall market. It’s calculated using historical stock and market returns:
Formula:
β=Covariance (Stock, Market)Variance (Market)\beta = \frac{\text{Covariance (Stock, Market)}}{\text{Variance (Market)}}
How to Interpret Beta:
- β = 1: Moves in tandem with market
- β > 1: Higher volatility than market
- β < 1: Defensive, less volatile
- β < 0: Rare, inversely correlated
📊 Case Study: Saudi Telecom Company (STC)
Overview:
- Stock: STC (7010.SR)
- Market Index: Tadawul All Share Index (TASI)
- Period: 60 months (monthly returns)
- Data Sources: Tadawul, Google Finance, Investing.com
- Tool: Excel Regression (LINEST function)
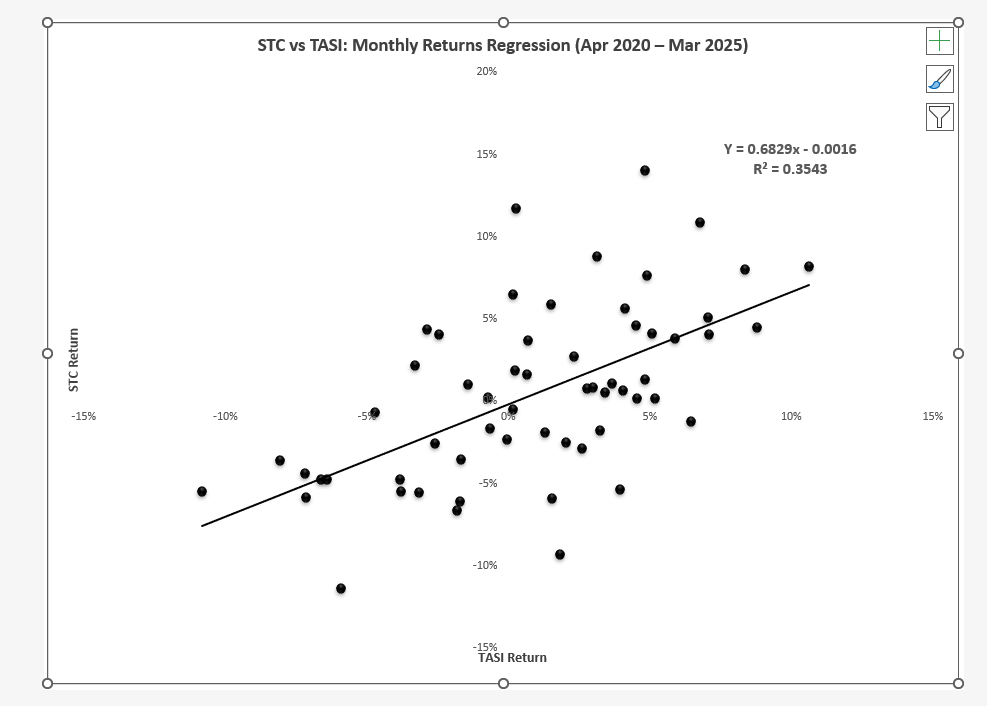
📊 STC Regression Beta Results
Metric | Value | Interpretation |
Beta (Slope) | 0.683 | Less volatile than the market (defensive stock) |
Alpha (Intercept) | -0.0016 | Slight underperformance |
R² (Goodness of Fit) | 0.354 | 35% of return variance explained by market |
CAPM Expected Return | 8.24% | With risk-free rate 5.17%, ERP 4.5% |
- 📈 Visual Representation
📌 Strategic Takeaways
- STC’s beta below 1 reflects its stable, telecom-driven revenue, positioning it as a defensive investment.
- Investors seeking lower volatility may find STC attractive for Saudi portfolios.
- Incorporate this beta in your Weighted Average Cost of Capital (WACC) calculations, adjusting leverage if necessary.
⚠️ Common Pitfalls in Beta Calculation
- Avoid short timeframes that introduce noise.
- Always use total returns, inclusive of dividends.
- Confirm the reliability with R² before trusting your beta value.
- Contextualize your data and understand underlying business dynamics.
Want the full Excel model?
Gain access to the exact Excel file used in this analysis, including formulas, trendlines, and return data.
🧐 Final Thoughts
Calculating beta doesn’t need complexity—it requires clarity. STC’s regression clearly demonstrates that precise modeling empowers smarter investment decisions.